My WSPR data collector is now running some days and I started with some basic data analysis.
The power on the bands 60m to 20m is about 100mW!
Spots over daytime
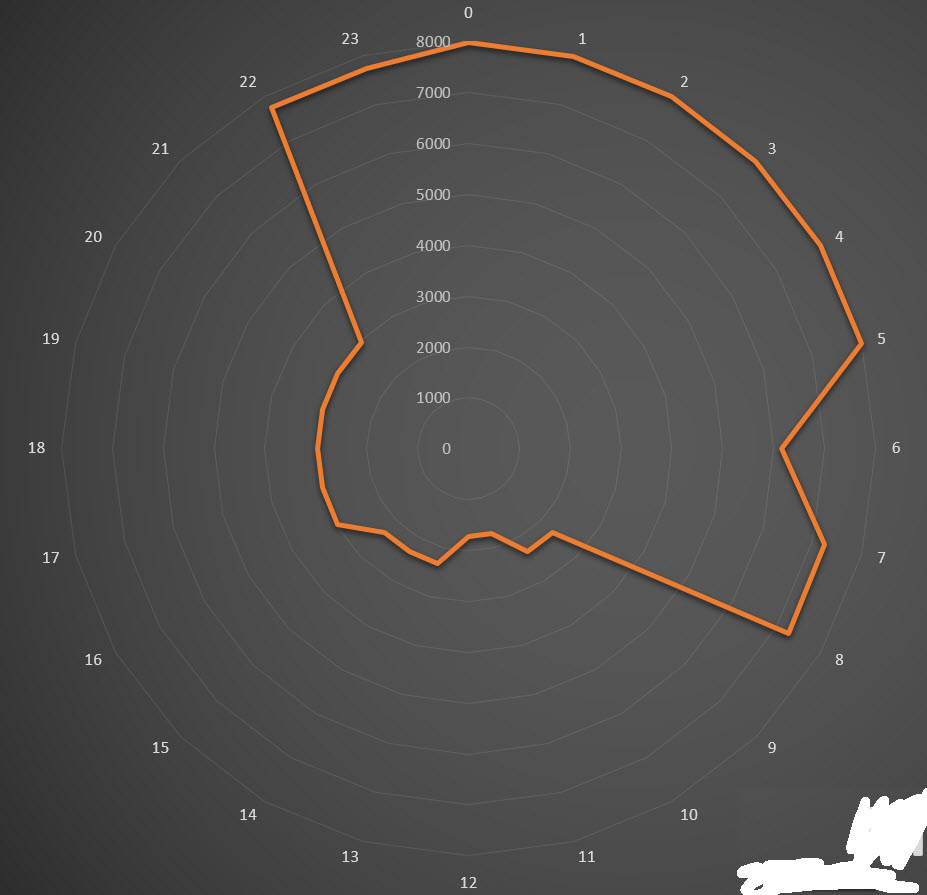
This diagram shows the number of spots on 40m over the daytime (0h00 - 23h59)
Spots over bearing
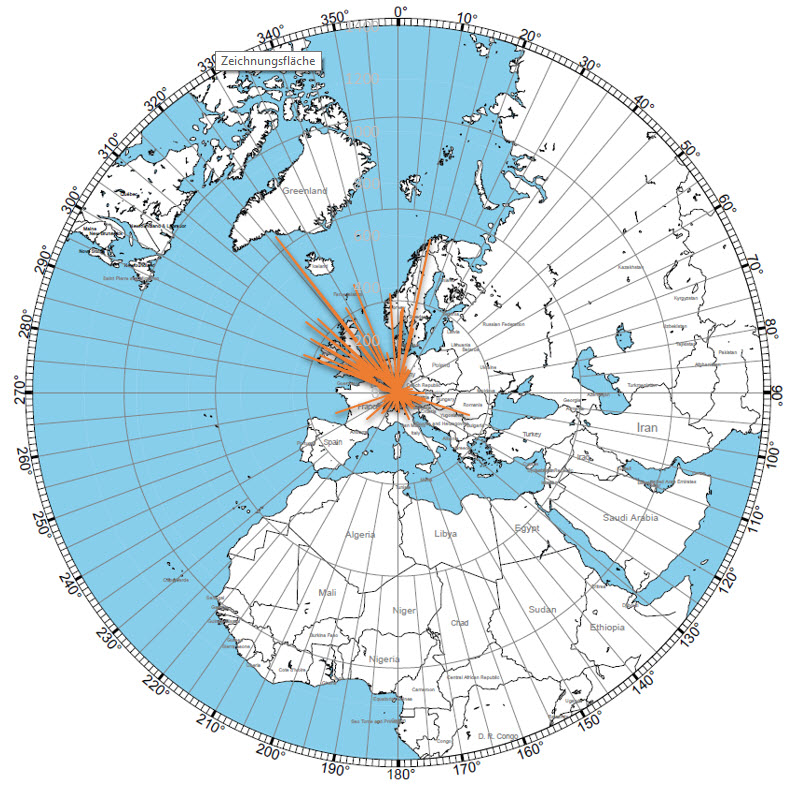
This diagram shows the number of spots on all bands (60m, 40m, 30m, 20m) on an azimuthal map. Thanks to NS6T for his great tool!
Distance over bearing

This diagram shows the maximum distance of all spots on all bands (60m, 40m, 30m, 20m) on an azimuthal map. Thanks to NS6T for his great tool!
Howto
All diagrams are created with the diagrams build into Microsoft Excel.
The data is inserted into a worksheet using external data from an MYSQL database connected via ODBC in my Windows PC.
The database is permanently fed by my WSPR data collector. Updating of the data in the Excel worksheet is pretty easy - ALT-F5 then the diagrams show the actual data!